Running a manufacturing business on Shopify requires more than just tracking sales. You need deep insights into inventory movements, production costs, profit margins, and demand patterns to make informed decisions. The right reports can transform raw data into actionable intelligence that drives operational efficiency and profitability.

This guide explores the essential Shopify reports that manufacturing businesses should leverage to optimize their operations and scale sustainably.

Why Analytics Matter for Manufacturing on Shopify

Manufacturing businesses face unique challenges compared to traditional retail operations. You're managing raw materials, tracking work-in-progress inventory, calculating complex product costs, and coordinating production schedules. Without proper analytics, you're flying blind.

Shopify's reporting capabilities, especially for Shopify Plus users, provide powerful tools to monitor every aspect of your manufacturing operation, from raw material procurement to finished goods delivery.

1. Inventory Reports: Your Production Backbone

Inventory management is critical for manufacturers. Running out of raw materials halts production, while excess inventory ties up capital and warehouse space.

Key Inventory Reports to Monitor

Inventory Snapshot Report

This report provides a complete view of your inventory at a specific point in time. For manufacturers, this is invaluable for:

  • Month-end inventory valuation
  • Financial reporting and reconciliation
  • Identifying slow-moving finished goods
  • Tracking raw materials vs. finished products

Inventory Sold Daily by Product
Understanding daily sales velocity helps you:

  • Adjust production schedules in real-time
  • Identify trending products that need increased production
  • Spot declining demand before you overproduce


Inventory Adjustments Report
Manufacturers constantly adjust inventory for:

  • Raw materials used in production
  • Work-in-progress conversions
  • Quality control rejections
  • Returns and defects

This report helps you maintain accurate inventory records and identify patterns in waste or quality issues.

Product Inventory Levels Report
Set up alerts when stock levels hit critical thresholds. This helps you:

  • Reorder raw materials before running out
  • Schedule production runs efficiently
  • Prevent stockouts of best-selling finished goods

Pro Tip for Manufacturers

Use Shopify's inventory tracking in combination with SKU variants to separate raw materials, work-in-progress, and finished goods. This creates clearer visibility into your production pipeline.

2. Sales Reports: Understanding Revenue Streams

Sales reports go beyond simple revenue tracking. For manufacturers, they reveal which products justify production costs and which markets are most profitable.

Essential Sales Reports

Total Sales Report
Track overall revenue trends to:

  • Identify seasonal production needs
  • Plan capacity and labor requirements
  • Set realistic production targets

Sales Over Time
This report shows trends by day, week, month, or year. Manufacturers can use this to:

  • Recognize seasonal demand patterns
  • Plan production schedules months in advance
  • Avoid overproduction during slow periods

Sales Attributed to Marketing
Understanding which marketing efforts drive sales helps you:

  • Calculate true customer acquisition costs
  • Determine marketing ROI for production decisions
  • Identify which products benefit most from promotion

Sales by Product Variant
For manufacturers producing multiple variants (sizes, colors, configurations), this report shows:

  • Which variants are most popular
  • Where to focus production resources
  • When to phase out underperforming variants

Manufacturing-Specific Insight

Cross-reference sales reports with production lead times. If a product takes 4 weeks to manufacture, use sales velocity data to trigger production 6 weeks before anticipated demand spikes.

3. Profit Reports: The Bottom Line for Manufacturing

Revenue means nothing if you're not profitable. Manufacturing businesses must track costs meticulously to ensure healthy margins.

Critical Profit Reports

Profit by Product Report
This report is essential but requires accurate setup. You must:

  • Add cost per item to every product and variant
  • Include material costs, labor, and overhead allocation
  • Update costs regularly as supplier prices change

The report reveals:

  • Which products are actually profitable
  • Where you're losing money despite high sales
  • Opportunities to adjust pricing or reduce costs

Profit by Variant Report
Different variants often have different cost structures. A larger size might use more material, or a specialized color might require expensive dye. This report helps you:

  • Price variants appropriately
  • Discontinue unprofitable variants
  • Focus production on high-margin items

Profit by POS Location
If you sell through multiple channels (online, wholesale, retail locations), this report shows:

  • Which channels are most profitable
  • Where to focus sales efforts
  • Whether wholesale pricing is sustainable

Setting Up Accurate Cost Tracking

For manufacturers, "cost per item" should include:

  • Raw material costs
  • Direct labor costs (time per unit × labor rate)
  • Variable overhead (utilities, packaging, shipping materials)
  • Allocated fixed overhead (equipment depreciation, facility costs)

Update these costs quarterly or whenever supplier prices change significantly.

4. ABC Product Analysis: Prioritizing Your Production

Not all products are created equal. ABC analysis categorizes products based on their contribution to revenue:

  • A Products: Top 20% of products generating 80% of revenue
  • B Products: Middle 30% of products generating 15% of revenue
  • C Products: Bottom 50% of products generating 5% of revenue

How Manufacturers Should Use ABC Analysis

Focus Production Resources on A Products
These are your bread and butter. Ensure:

  • Raw materials are always in stock
  • Production capacity prioritizes these items
  • Quality control is rigorous
  • You have backup suppliers for critical materials

Optimize B Products
These products have potential. Consider:

  • Reducing production costs to improve margins
  • Increasing marketing to boost sales
  • Bundling with A products

Evaluate C Products
These products may be:

  • Candidates for discontinuation
  • Produced only on demand
  • Kept for strategic reasons (customer favorites, complementary items)

The key is not to spread production resources too thin across products that don't contribute meaningfully to profitability.

5. Demand Forecasting: Planning Production Ahead

While Shopify doesn't have a dedicated "demand forecasting report," you can build forecasts using historical sales and inventory data.

Building a Manufacturing Forecast

Step 1: Analyze Historical Sales Patterns
Export sales data from the past 1-2 years and identify:

  • Seasonal trends
  • Growth rates
  • Impact of marketing campaigns
  • External factors (economic conditions, trends)

Step 2: Factor in Lead Times
Add your production and procurement lead times to the forecast:

  • Raw material procurement: 2-4 weeks
  • Production time: 1-4 weeks
  • Shipping to warehouse: 1-2 weeks

Step 3: Set Safety Stock Levels
Based on variability in demand and lead times, determine:

  • Minimum safety stock for raw materials
  • Finished goods buffer inventory
  • Reorder points that trigger production

Step 4: Create Production Schedules
Use forecasts to create rolling production schedules:

  • 3-month production plan (firm)
  • 6-month outlook (tentative)
  • 12-month capacity planning

Tools for Advanced Forecasting

Consider integrating Shopify with:

6. Customer Reports: Understanding Your Market

Manufacturing businesses often overlook customer data, but it's crucial for production planning.

Valuable Customer Reports

Customers Over Time
Growing customer base indicates you should:

  • Scale production capacity
  • Invest in automation
  • Build supplier relationships

Returning Customers Report
High repeat purchase rates suggest:

  • Product quality is meeting expectations
  • You should maintain consistent production standards
  • Expanding product lines could capture more wallet share

Customers by Location
Geographic concentration helps you:

  • Optimize shipping and logistics
  • Consider regional production facilities
  • Tailor products to regional preferences

7. Custom Reports: Building What You Need

While Shopify's default reports provide excellent baseline insights, manufacturing businesses often need custom reports tailored to their specific operations. Shopify's Analytics Exploration feature gives you the flexibility to create exactly the reports you need.

What is Analytics Exploration?

Shopify Analytics New Exploration for Manufacturers

Analytics Exploration is Shopify's powerful custom reporting tool available to merchants on all Shopify plans. It allows you to:

  • Build custom reports from scratch with the exact metrics and dimensions you need
  • Modify existing default reports to better answer your specific business questions
  • Add multiple metrics, dimensions, comparisons, and filters to explore data in depth
  • Choose different visualization types (line charts, bar charts, tables) to identify trends
  • Save your custom explorations for future use and recurring analysis
  • Get help from Shopify's AI agent to create the exact query you're looking for

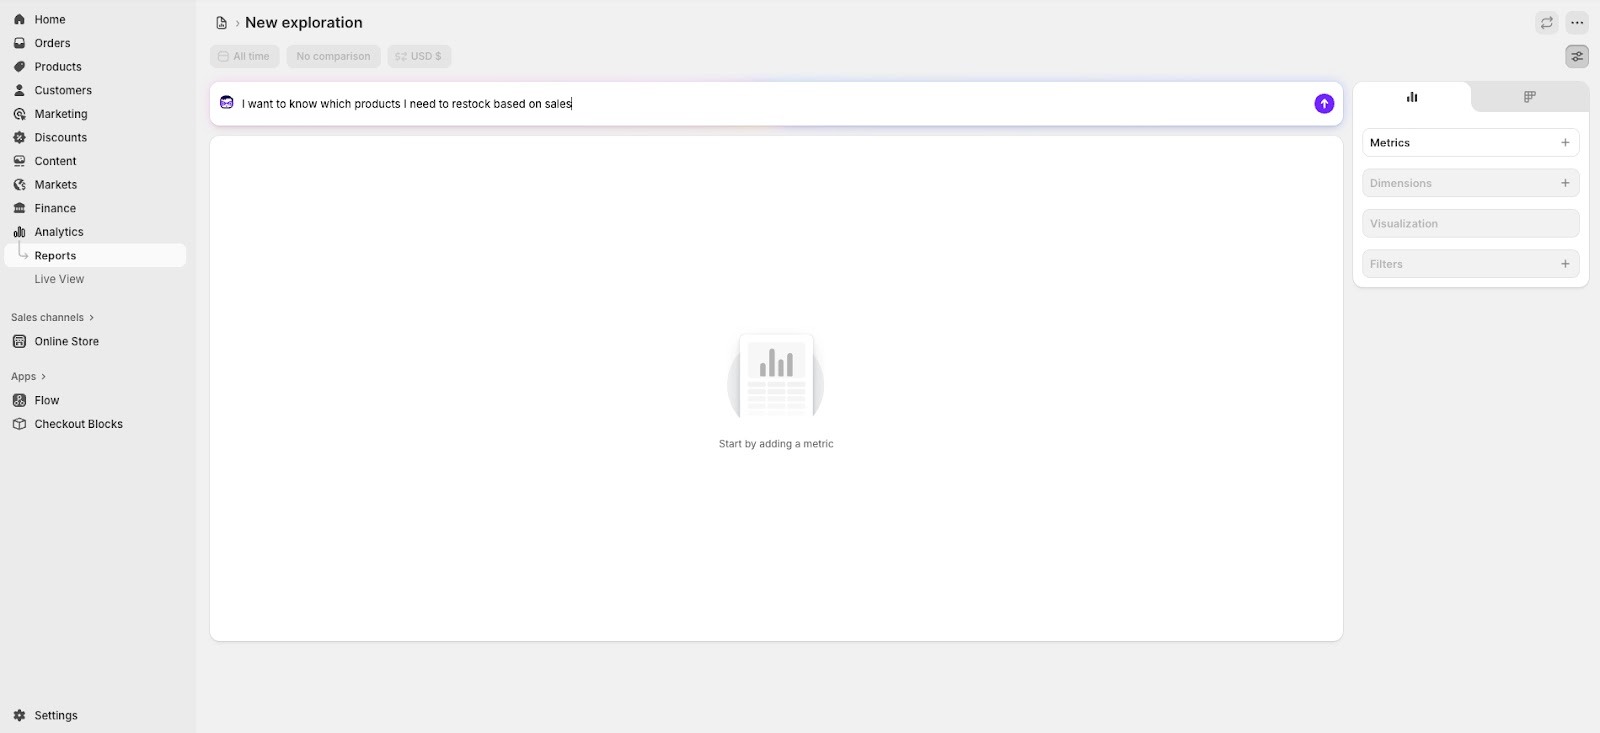
To start an exploration, navigate to Analytics > Reports in your Shopify admin and click New exploration. The interface includes an AI assistant that helps you build queries by understanding your reporting needs in plain language.

What You Can Create with Analytics Exploration

Shopify's Analytics Exploration works with your store's native data, including sales, orders, inventory, and customer information. Manufacturing businesses can create valuable custom explorations such as:

Inventory and Sales Analysis

  • Inventory turnover by product or variant
  • Sales velocity trends over custom time periods
  • Low-stock alerts for specific product categories
  • Inventory value by location or collection
  • Products with high sales but low inventory (reorder priorities)

Profitability Reports

  • Profit margins by product, variant, or collection (requires cost data in Shopify)
  • Revenue by customer segment or sales channel
  • Discount impact on profitability
  • Average order value by customer type or location


Order Fulfillment Insights

  • Average fulfillment time by product or location
  • Order volume by day/week/month to plan production capacity
  • Unfulfilled orders tracking
  • Returns and refunds by product or category

Manufacturing Metrics That Require External Integration

Detailed manufacturing and supply chain metrics are not available in Shopify's native data. To track the following, you'll need to integrate with manufacturing ERP systems or specialized apps:

Production Efficiency Metrics

  • Units produced per labor hour
  • Production cost per unit trends
  • Defect rates and quality control metrics
  • Equipment utilization rates

Supply Chain Reports

  • Supplier lead time tracking
  • Raw material cost trends
  • Vendor performance scorecards
  • Production cycle time analysis

To achieve these manufacturing-specific reports, consider:

  • Integrating Shopify with manufacturing or ERP systems that track these metrics (learn more about Shopify ERP integrations)
  • Using Shopify metafields to store additional manufacturing data
  • Leveraging specialized manufacturing apps that sync data with Shopify
  • Exporting Shopify data and combining it with external analytics tools (Power BI, Tableau)

Example: Creating a Custom Inventory Reorder Report

Let's say you want to identify which products are selling quickly but running low on inventory, so you can prioritize production. Using Analytics Exploration, you can:

  1. Start a new exploration in Analytics > Reports
  2. Ask the AI agent: "Show me products with total sales, current inventory quantity, and inventory turnover rate for the last 30 days"
  3. The agent will build the query using relevant metrics (net sales, quantity sold, available inventory) and dimensions (product name, variant)
  4. Refine by adding filters (e.g., only products with inventory below 50 units)
  5. Sort by sales velocity to see which low-stock items are your best sellers
  6. Choose a table visualization to create a clear reorder priority list
  7. Save the exploration to run weekly for production planning meetings

This type of custom analysis helps you prioritize which products need immediate production attention based on actual sales data and current stock levels, preventing stockouts of your most popular items.

Setting Up Your Shopify Analytics for Manufacturing Success

Step 1: Configure Your Products Properly

  • Add accurate costs to every product and variant
  • Use SKUs systematically (raw materials, WIP, finished goods)
  • Set up inventory tracking for all items
  • Create product categories that match your production lines

Step 2: Establish Regular Reporting Cadence

  • Daily: Inventory levels, orders received
  • Weekly: Sales by product, production requirements
  • Monthly: Profit reports, ABC analysis
  • Quarterly: Demand forecasts, cost updates

Step 3: Integrate with Other Systems

Consider connecting Shopify with:

  • Accounting software (QuickBooks, Xero) for financial reporting
  • Manufacturing ERP for production scheduling
  • Inventory management apps for advanced forecasting
  • Business intelligence tools (Tableau, Power BI) for deeper analysis

Step 4: Train Your Team

Ensure that:

  • Production managers understand how to read sales forecasts
  • Inventory teams know how to interpret stock reports
  • Finance team can analyze profit reports
  • Leadership reviews KPI dashboards regularly

Common Mistakes Manufacturing Businesses Make

Not Updating Product Costs

Material costs change frequently. Outdated costs lead to:

  • Inaccurate profit reports
  • Poor pricing decisions
  • Margin erosion without awareness

Solution: Review and update costs monthly or quarterly.

Ignoring Slow-Moving Inventory

Overproduction ties up capital and warehouse space.

Solution: Use ABC analysis and inventory turnover reports to identify slow movers and adjust production accordingly.

Focusing Only on Revenue

High revenue with low margins doesn't sustain a business.

Solution: Prioritize profit reports and margin analysis over pure sales numbers.

Not Planning for Seasonality

Many manufacturers get caught off-guard by seasonal demand.

Solution: Analyze multi-year sales patterns and build production schedules that anticipate seasonal peaks.

Manual Reporting Processes

Manually compiling data from multiple sources wastes time and introduces errors.

Solution: Automate report generation and delivery using Shopify Flow or n8n for more complex workflows. Schedule reports to run automatically and email stakeholders.

Advanced Analytics Strategies

Cohort Analysis for Product Lines

Track how product lines perform over their lifecycle:

  • Initial launch velocity
  • Growth and maturity phases
  • Decline indicators

This helps you plan new product introductions and phase out declining items strategically.

Contribution Margin Analysis

Go beyond gross profit to understand:

  • Variable costs per unit
  • Fixed cost allocation
  • Break-even volumes
  • Optimal production quantities

Scenario Planning

Use historical data to model scenarios:

  • What if demand increases 20%?
  • Can we handle that with current capacity?
  • What if raw material costs increase 15%?
  • How does that affect pricing and profitability?

Measuring Manufacturing Success: Key KPIs

Track these metrics consistently:

Operational KPIs

  • Inventory turnover ratio
  • Days inventory outstanding
  • Production cycle time
  • Order fulfillment rate

Financial KPIs

  • Gross profit margin by product
  • Operating profit margin
  • Return on inventory investment
  • Cost of goods sold as % of revenue

Customer KPIs

  • Customer acquisition cost
  • Customer lifetime value
  • Repeat purchase rate
  • Average order value

Conclusion: Data-Driven Manufacturing Decisions

Manufacturing businesses that leverage Shopify's reporting capabilities gain significant competitive advantages. By consistently monitoring inventory, sales, profitability, and demand patterns, you can:

  • Reduce waste and overproduction
  • Optimize inventory levels
  • Focus resources on profitable products
  • Plan production schedules proactively
  • Make pricing decisions based on real costs
  • Scale operations with confidence

Start with the core reports (inventory, sales, and profit) and ensure your data is accurate. Then expand into ABC analysis and demand forecasting. Finally, build custom reports tailored to your specific manufacturing operations.

Remember: The best report is the one you actually use. Start simple, establish routines, and gradually expand your analytics capabilities as your team becomes more data-driven.

Your manufacturing business deserves better than gut-feel decisions. Let Shopify's analytics guide you to smarter, more profitable operations.

Ready to optimize your manufacturing analytics? Start by auditing your current Shopify reports and ensuring your product costs are accurate. That single step will unlock the insights you need to make better production and pricing decisions.