
.png)
If your operations team sends a weekly summary report, there is a good chance the process looks like this: someone opens a spreadsheet, copies out the key numbers, pastes them into a Google Doc, formats it, and emails the link. Every week.
This tutorial replaces that process with an n8n workflow that reads the data directly from Google Sheets, fills a pre-built Google Doc template with the latest figures, and emails the report link to whoever needs it. The workflow runs on a schedule. Nobody needs to be involved.
The use case here is a weekly ops report, but the pattern works for any recurring document: shift summaries, KPI digests, inventory status reports, or supplier scorecards.
Schedule Trigger (runs Monday at 8am)
    → Google Sheets (read this week's data)
    → Code node (aggregate into summary figures)
    → Google Drive (copy the template doc to create a fresh report)
    → Google Docs (replace placeholders with real data)
    → Gmail (send the report link to the ops lead)
The template approach means your report format is maintained in Google Docs, not in code. Updating the layout or adding new sections is a doc edit, not a workflow edit.
n8n instance. n8n Cloud or self-hosted, version 1.0 or later.
Google Sheets OAuth2 credential in n8n. Authorize against the account that owns the operations data spreadsheet.
Google Docs OAuth2 credential in n8n. Same process, select Google Docs OAuth2. This is the same underlying OAuth as Sheets and Drive: if you are already authenticated for Sheets, the Docs credential uses the same Google account.
Google Drive OAuth2 credential in n8n. Needed to copy the template file at the start of each run.
Gmail OAuth2 credential in n8n. Authorize against the account that will send the report email.
Before building the workflow, create the report template in Google Docs. This is the document n8n will copy and fill in each time the workflow runs.
Create a new Google Doc and set up your report structure. Use double-brace placeholders for any value n8n will fill in:
Weekly Operations Report - {{week_of}}

Production Summary
Total Output This Week: {{total_output}} units
Target: {{output_target}} units
Variance: {{output_variance}}%

Quality
First Pass Yield: {{first_pass_yield}}%
Scrap Rate: {{scrap_rate}}%

Open Issues
{{open_issues}}

On-Time Delivery
{{otd_rate}}% of orders shipped on time this week

Submitted by Operations Dashboard - {{report_date}}
Format the document however your team normally reads it. The placeholders ({{week_of}}, {{total_output}}, etc.) are what n8n will search for and replace.
After creating the template, note the Google Doc file ID from its URL:https://docs.google.com/document/d/FILE_ID_HERE/edit
Add a Schedule Trigger node. For a weekly ops report:
The report generates Monday morning so the ops lead has the previous week's numbers at the start of the week.
Add a Google Sheets node after the trigger.
Configuration:
If your spreadsheet already aggregates weekly figures on a summary tab, you may only need one row. If the source data is a daily log, the Code node in the next step will aggregate it.
Add a Code node after the Google Sheets node to calculate the summary figures the report needs.
For a daily production log where each row is one day's output:
const rows = $input.all();

const totalOutput = rows.reduce((sum, r) => sum + Number(r.json['Actual Units'] || 0), 0);
const totalTarget = rows.reduce((sum, r) => sum + Number(r.json['Target Units'] || 0), 0);
const avgYield = rows.reduce((sum, r) => sum + Number(r.json['Yield %'] || 0), 0) / rows.length;
const avgScrap = rows.reduce((sum, r) => sum + Number(r.json['Scrap Rate %'] || 0), 0) / rows.length;
const otdRate = rows.filter(r => r.json['On Time'] === 'Yes').length / rows.length * 100;

const variance = totalTarget > 0
  ? (((totalOutput - totalTarget) / totalTarget) * 100).toFixed(1)
  : '0.0';

const weekOf = new Date().toLocaleDateString('en-US', { month: 'long', day: 'numeric', year: 'numeric' });

return [{
  json: {
    week_of: weekOf,
    total_output: totalOutput.toLocaleString(),
    output_target: totalTarget.toLocaleString(),
    output_variance: variance,
    first_pass_yield: avgYield.toFixed(1),
    scrap_rate: avgScrap.toFixed(1),
    otd_rate: otdRate.toFixed(1),
    open_issues: rows.filter(r => r.json['Open Issue']).map(r => `- ${r.json['Open Issue']}`).join('\n') || 'None',
    report_date: new Date().toLocaleDateString('en-US')
  }
}];
Adjust the column names to match your actual spreadsheet headers. Run the node with your test data and confirm the output object contains all the placeholder keys the template uses.
Add a Google Drive node.
Configuration:
Ops Report - {{ $json.week_of }}
This creates a new Google Doc (a copy of the template) with the week's date in the filename. The original template stays untouched for the next run.
The node output includes the ID of the newly created file. Note the expression to reference it in the next step: {{ $json.id }}.
Add a Google Docs node after the Drive node.
Configuration:
{{ $('Google Drive').item.json.id }}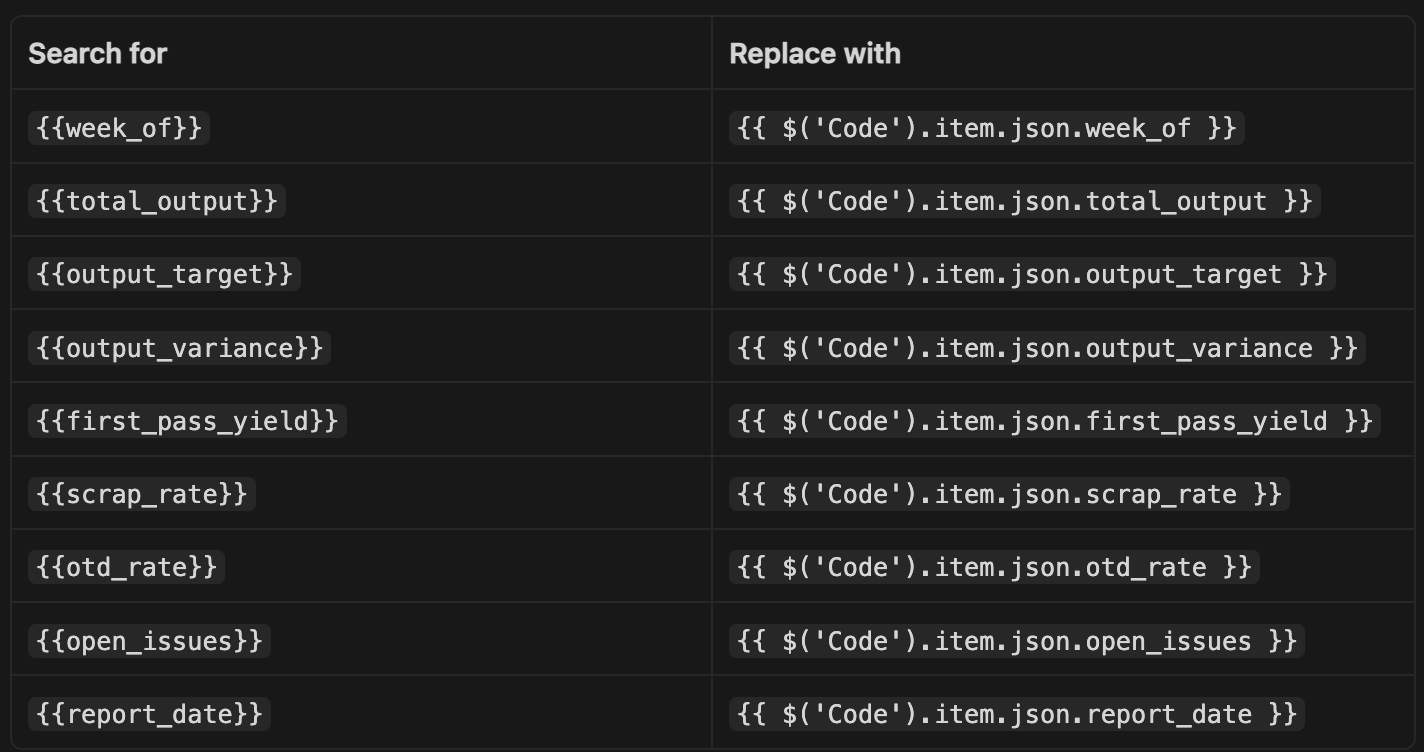
Run the node and open the newly created Google Doc. Confirm every placeholder has been replaced with the correct value.
Add a Gmail node as the final step.
Configuration:
Weekly Ops Report - {{ $('Code').item.json.week_of }}Your weekly operations report is ready.
View the report: https://docs.google.com/document/d/{{ $('Google Drive').item.json.id }}/edit
Generated automatically from the operations log. Reply to this email if anything looks off.
Run the full workflow from the trigger and confirm the email arrives with a working link to the completed doc.
Each run creates a new Google Doc in the root of the account's Drive. To keep reports organized, update the Google Drive Copy File node to specify a parent folder:
All generated reports land in the same folder, in chronological order by filename.
Add a Slack notification alongside the email. After the Gmail node, add a Slack node: "Weekly ops report is ready: https://docs.google.com/document/d/{{ $('Google Drive').item.json.id }}/edit". Keeps the ops channel current without anyone manually posting links.
Pull from multiple sheets. If production data, quality data, and delivery data live on separate tabs, add additional Google Sheets nodes before the Code node and merge the outputs. The Code node aggregates all of them into the same output object.
Change the frequency. For a daily shift summary, set the Schedule Trigger to run at shift end (e.g., 4pm daily on weekdays). The same workflow structure works for any reporting cadence.
Add charts. Google Docs does not support inserting charts via the API directly, but you can embed a chart from Google Sheets using the Sheets Charts API and referencing the chart URL in the doc. For most ops reports, a data table is sufficient.
Google Drive "Copy File" requires Drive scope. Confirm your Google Drive OAuth2 credential has the drive scope (not just drive.file). The "Copy File" operation requires read access to files not created by the app itself. During credential setup, accept the full Drive permissions when prompted.
Placeholder case sensitivity. The Google Docs "Replace Text" operation is case-sensitive by default. If your template uses {{Week_Of}} but your Code node outputs week_of, the replacement will not match. Keep placeholder names consistent between the template and the Code node output.
Referencing the copied doc ID across nodes. The Google Drive node outputs the new file's metadata including its ID. Reference it in subsequent nodes using the node name: {{ $('Google Drive').item.json.id }}. If you rename the Drive node, update this reference in the Docs and Gmail nodes.
The Flow Kaizen guide covers how to sequence reporting workflows alongside your core automation builds, including how to connect these reports to a live operations dashboard.

.png)
