

.png)
OEE (Overall Equipment Effectiveness) is the most widely used measure of manufacturing performance. It answers one question: of the time a machine or production line is scheduled to run, how much of that time is producing good parts at full speed?
A single OEE percentage summarizes three separate problems: equipment that is not available when it should be, equipment that runs slower than its rated speed, and output that fails quality standards. Tracking OEE without separating these three components is like tracking a composite exam score without knowing which sections a student failed.
This post covers the OEE formula, how to calculate each component, a worked manufacturing example, the benchmarks that define world-class performance, and the most common mistakes operations teams make when calculating OEE.
OEE = Availability × Performance × Quality
All three factors are percentages expressed as decimals. The result is also a percentage.
Example: An OEE of 0.85 × 0.90 × 0.95 = 0.727, or 72.7%.
Each component is calculated separately using data from your production records or machine monitoring system. The sections below define each component and show how to calculate it.
Availability measures the percentage of scheduled production time that the equipment was actually running.
Formula: Availability = (Planned Production Time − Downtime) / Planned Production Time
Where:
What to exclude from downtime: Planned maintenance, scheduled breaks, and tooling changeovers planned in advance are not counted as downtime in OEE. They are excluded from Planned Production Time entirely. Only unplanned stops count against Availability.
Example:
Performance measures how fast the equipment ran during the time it was actually running, relative to its rated or ideal cycle time.
Formula: Performance = (Ideal Cycle Time × Total Units Produced) / Operating Time
Where:
Alternative formula: Performance = Actual Output / Maximum Possible Output
Where Maximum Possible Output = Operating Time / Ideal Cycle Time
Example (continuing from above):
A Performance score below 100% means the equipment is producing more slowly than its rated speed. Common causes: minor stoppages counted too short to log as downtime, reduced speed settings, operators running below pace, or worn tooling degrading cycle time.
Quality measures the percentage of units produced that meet quality specifications on the first pass, without rework.
Formula: Quality = Good Units / Total Units Produced
Where Good Units = Total Units Produced − Defective Units (including rework and scrap)
Example (continuing from above):
Using the three components from the examples above:
OEE = Availability × Performance × QualityOEE = 89.3% × 88.0% × 94.5%OEE = 0.893 × 0.880 × 0.945 = 0.743 = 74.3%
This machine ran at 74.3% OEE for the shift. Of the 420 minutes it was scheduled to produce, it effectively delivered 374 × 0.943 = 312 good units in the time equivalent of 312 ideal-cycle-time minutes. The remaining 108 minutes of scheduled time was lost to downtime, slow running, and quality failures.
The value of tracking OEE with all three components is that it reveals where the loss is coming from.
In this example:
The biggest loss is Performance, not Availability. A plant that focuses exclusively on reducing downtime while ignoring the slow-running problem will miss the largest source of lost capacity. OEE shows you all three simultaneously.
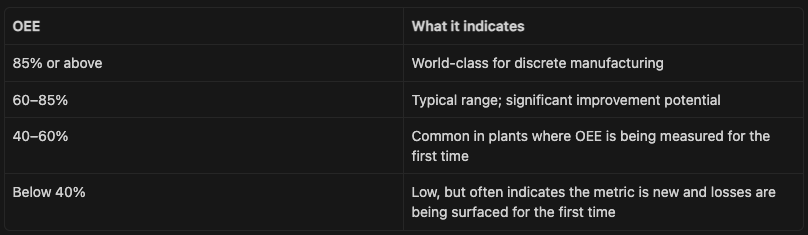
World-class OEE of 85% is based on an Availability of approximately 90%, Performance of approximately 95%, and Quality of approximately 99.7%. These are not aspirational targets for every plant: industry type, product complexity, and equipment age all affect what is achievable.
For most manufacturing environments, tracking OEE and improving it by 5–10 percentage points over 12 months is a more actionable target than chasing 85%.
A plastics manufacturer runs three injection molding machines on a 10-hour shift. Machine 2 has been showing quality issues and the plant manager wants to understand whether the problem is quality alone or if there are availability and performance losses compounding it.
Machine 2, Single Shift Data:
Calculations:
The plant manager suspected a quality problem. The calculation shows Quality at 88% is a problem, but Performance at 84.5% is a larger source of loss. The machine is producing 15.5% fewer parts per hour than it is rated for. That is not a quality issue: it is a speed issue, likely from the mold jam disrupting the cycle and operators running cautiously afterward.
Correct diagnosis leads to a different intervention. Investigating why cycle times are slow (operator behavior, mold condition, cooling parameters) is a different conversation than investigating why 12% of parts are failing inspection.
Planned maintenance, scheduled breaks, and planned changeovers are excluded from Planned Production Time. They are not losses against Availability. Including them in the downtime figure overstates the Availability problem and understates the other two components.
Performance is calculated against the ideal (fastest possible) cycle time, not the average. If your machine typically runs at 1.2 minutes per unit but is rated at 1.0 minute, using 1.2 as the ideal hides a 20% Performance gap that is actually a loss.
Units that required rework before passing inspection are defects for OEE purposes. First pass yield is what Quality measures. A unit that passes after rework is still a Quality loss in OEE.
Plant-level OEE is an average that hides individual machine performance. A plant with three lines running at 90%, 90%, and 40% OEE shows a plant-level OEE of 73%, which looks mediocre. The actual problem is one specific machine running at 40%, which points to a specific investigation and fix. Track OEE at the machine or line level.
An OEE of 68% tells you something is wrong. An OEE of 68% with Availability 95%, Performance 75%, Quality 96% tells you the machine is running at three-quarters of its rated speed for most of the shift. Those two pieces of information lead to very different conversations.
The biggest practical challenge with OEE is not the calculation: it is capturing the inputs consistently. Manual data collection (operators logging downtime events and unit counts on paper at shift end) produces OEE numbers that are at least partially estimated and often incomplete.
Automation options by equipment capability:
Equipment with a network interface or API: n8n can receive real-time signals from PLCs and SCADA systems via webhooks or OPC-UA bridges. Each downtime event writes to a database automatically. Unit counts and defect counts update in real time. OEE calculates at shift end without any manual entry.
Equipment without network connectivity: A low-cost IoT sensor (power monitoring or vibration sensor) connected to a cloud platform can detect run/stop states automatically, eliminating manual downtime logging while unit counts and quality data still come from operator input.
ERP-connected environments: If your ERP captures production orders, completion quantities, and quality holds, n8n can pull this data on a schedule and calculate OEE from the ERP records. See How to Connect Your ERP to n8n Without a Native Connector for the integration approach.
Once the data is flowing automatically, OEE feeds your operations dashboard in real time instead of being calculated the morning after. See How to Build a Manufacturing Operations Dashboard with Retool for the dashboard build that connects these figures to a live, actionable interface.
For more context on how OEE fits into the broader set of manufacturing KPIs, see Manufacturing KPIs: The Metrics Operations Teams Actually Track.
The Flow Kaizen guide covers how to build the automation workflows that feed your OEE calculation and connect machine data to a live dashboard without custom development work.

.png)
