
.png)
WIP inventory (Work in Process, also written Work in Progress) is material that has entered the production process but has not yet been completed. It is past the raw material stage and short of finished goods.
In a manufacturing plant, WIP includes: partially assembled components waiting in queue between process steps, items currently in a machine or work center being processed, and units that have passed some steps but are waiting to enter the next. It is, in the simplest sense, everything on the floor that is not yet a product you can ship.
WIP is significant not because it is hard to define but because most manufacturers do not know how much of it they have at any given moment.
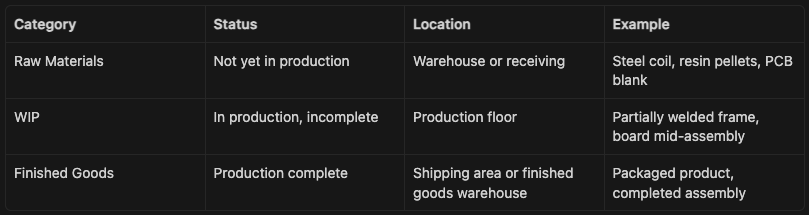
The boundary between categories matters for accounting (each is carried at different values on the balance sheet) and for operations (each responds to different controls and signals).
Raw materials are controlled by purchasing and receiving. Finished goods are controlled by scheduling and shipping. WIP is controlled by production itself: the speed and flow of work through the floor.
Ending WIP (units) = Beginning WIP + Units Started - Units Completed
This is the basic flow equation for any inventory category: you start with what you had, add what entered, subtract what exited.
A production line starts a shift with 40 units in process (from the previous shift's incomplete work). During the shift, 300 new units enter the production process. By shift end, 280 units are completed and move to finished goods.
Ending WIP = 40 + 300 - 280 = 60 units
The line ends the shift with 60 units still in process, up from 40 at the start. WIP grew by 20 units. This means the line put more into production than it completed, which is typical when a bottleneck step is slower than the input rate.
For balance sheet purposes, WIP is carried at the cost of inputs applied so far:
WIP Value = Raw Materials Cost Applied + Direct Labor Applied + Manufacturing Overhead Applied (to date)
A unit that has passed through machining but not assembly is carried at the cost of the raw material plus the machining labor and overhead applied. Assembly costs are not yet included because that step has not occurred.
Operations teams generally track WIP in units. Accounting teams track WIP in value. Both measures are needed.
WIP builds up when any step in the production process cannot keep pace with the step before it. Units arrive at the slower step faster than they can be processed and pile up in queue. This is the nature of a bottleneck: the work center where WIP is highest is usually the constraint on the line.
Three common causes of WIP accumulation:
Unbalanced line speeds. When one process step is significantly faster than the next, work in queue grows continuously until the faster step is slowed or the bottleneck is resolved. Line balancing (setting work content at each step to match takt time) is the standard approach.
Batch production. When production runs in large batches rather than one-piece flow, WIP accumulates between batches. A batch of 100 units entering machining does not begin moving to the next step until all 100 are complete, even though the first unit finished machining hours ago.
Unplanned downtime. When a downstream step goes down unexpectedly, upstream steps continue producing and WIP accumulates in front of the stopped step. MTBF and MTTR (Mean Time Between Failures and Mean Time to Repair) directly affect how much WIP buffers need to absorb these events.
For more on the metrics that connect to these causes, see Manufacturing KPIs: The Metrics Operations Teams Actually Track.
The relationship between WIP and lead time is captured by Little's Law, a fundamental principle from queuing theory:
Lead Time = WIP / Throughput Rate
Where Throughput Rate is the number of units the line completes per unit of time.
A manufacturing line has 200 units of WIP in process at any given time and completes 50 units per hour.
Lead Time = 200 / 50 = 4 hours
If WIP is reduced to 100 units (same throughput), average lead time drops to 2 hours. The same number of units per hour exit the line, but each unit spends less time waiting in queue because there is less competition for each process step.
This is the core mathematical argument for lean manufacturing's focus on WIP reduction: lower WIP equals shorter lead time, with no change to equipment or staffing. The improvement comes from flow, not from running faster.
In lean manufacturing, excess WIP is classified as one of the seven wastes (the inventory waste category). The goal is not to eliminate WIP entirely (some WIP is necessary to decouple process steps and absorb variability) but to hold WIP at the minimum level needed to maintain flow.
Kanban systems are designed specifically to control WIP. A kanban card or signal must exist before a unit can enter a process step. When all cards are in use (the step's WIP limit is reached), upstream steps stop producing and instead help the downstream step clear the queue. WIP limits force bottlenecks to become visible because they stop upstream production rather than allowing unlimited accumulation.
The practical limit on WIP between two steps is calculated from two inputs: the throughput rate of the downstream step and the acceptable wait time. If the downstream step processes 10 units per hour and the acceptable queue time is 2 hours, the WIP limit between them is 20 units.
Before running a kanban or WIP reduction initiative, mapping where WIP accumulates is the first step. See Value Stream Mapping: How to Find the Processes Worth Automating for the approach.
WIP is one of three inventory categories that operations planning must account for. For overall inventory health, raw material buffers are sized using safety stock and reorder point calculations to prevent production stoppages from upstream shortages.
For safety stock and reorder point formulas, see Safety Stock Formula and Reorder Point Formula.
WIP does not have a safety stock equivalent (WIP is in motion, not sitting in a buffer by design), but it does have planning implications: the WIP position at shift end tells the next shift what it will start with and influences how much new material to release into production.
The gap between knowing how much WIP you have and not knowing comes down to one problem: counting in-process units requires going to the floor and counting them, which most operations teams do once per shift at best.
Automated WIP tracking eliminates the counting step by capturing unit movements at process boundaries:
Barcode or QR code scanning at work center entry and exit. Each unit is scanned when it enters a process step and again when it exits. The difference between entry scans and exit scans at any step is the current WIP count at that step. An n8n webhook receives each scan event and writes to a Google Sheets WIP log or a database. WIP count is always current.
ERP routing step completions. If your ERP manages production orders with routing, each operation completion transaction updates the production order status. n8n can query the ERP API on a schedule, pull in-progress operation counts, and write them to a WIP tracking sheet. No barcode scanning needed if the ERP data is reliable.
Automated WIP alerts. An n8n workflow monitors WIP count at each step against a configured kanban limit. When WIP at a specific step exceeds the limit, the workflow sends an alert to the production supervisor. This is the automated equivalent of a kanban signal: the system stops upstream production from proceeding without human intervention.
A basic implementation using Google Sheets:
Schedule Trigger (every 30 minutes during shift hours)
    → Google Sheets (read current WIP count per step from scan log)
    → IF node (does any step exceed its WIP limit?)
    → Gmail or Slack (alert supervisor with step name, current WIP, and limit)
For the Google Sheets connection that enables this workflow, see How to Automate Google Sheets with n8n (No Code).
WIP is a subcategory of inventory. The three inventory categories are raw materials, WIP, and finished goods. WIP specifically refers to items that have started production but are not yet complete. Raw materials have not yet entered production. Finished goods have completed production.
Yes. WIP is recorded as a current asset on the balance sheet because it is expected to be converted to finished goods (and then to revenue) within the current operating cycle. It is carried at the cost of inputs applied so far (materials, labor, overhead).
The primary approaches are: implement WIP limits at each process step (kanban), reduce batch sizes to encourage one-piece flow, address the bottleneck that is causing WIP to pile up before it, and improve MTTR to reduce queue buildup during downtime events. Little's Law shows that reducing WIP directly reduces lead time when throughput is held constant.
There is no universal benchmark. The right WIP level is the minimum needed to decouple process steps and absorb normal variability without causing stoppages. A practical method: set the WIP limit at each step to the downstream step's throughput rate multiplied by the acceptable queue time. Start with a generous limit and reduce it as process stability improves.
The Flow Kaizen guide covers how to build WIP tracking and alert workflows as part of a broader production monitoring automation plan, including how to connect WIP data to your operations dashboard alongside OEE and KPI metrics.

.png)
